I was recently inspired by a Facebook post that shared a number of Spirograph-like images of how 5 of the planets change in distance and direction as seen from the Earth. The original image (used to be) here...
https://luminatress.com/post/184864366539/gaylienz-path-traced-by-these-planets-as-seen
But I was immediately concerned by how 'conveniently symmetrical' those images were and was further troubled by the Mercury image which showed a huge variation in distance from the earth, and a single loop that really didn't seem likely at all. As an amateur astronomer - I have a reasonable intuition for these things.
So I set about creating a simple spreadsheet to produce these patterns for myself, to see if they were valid, and here they are...
---
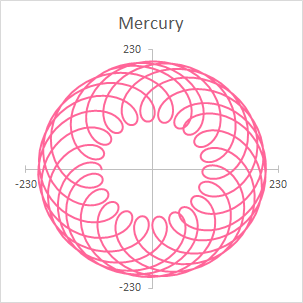
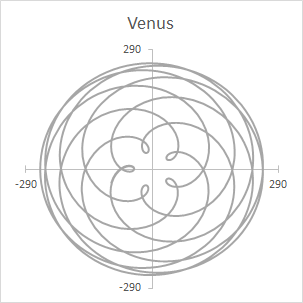
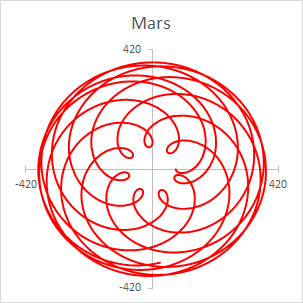
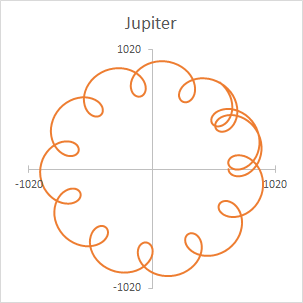
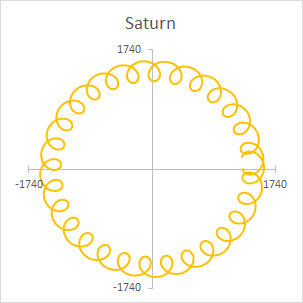
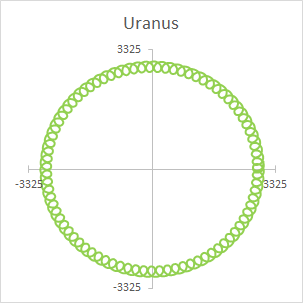
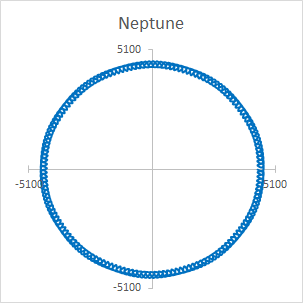
You may notice that the patterns (as expected) aren't perfectly symmetrical as the ratio of the periods of the planetary orbits are not simple fractional (or integer) multiples of the earth's orbital period (although Venus comes close to 5/8th). You'll also notice Mercury's pattern is very different from the illustration on the astrology website, and I suspect an error on their part.
How was this done?
The maths isn't too complicated.
First, I looked up the orbital radius and period for each planet from a reputable source (such as: https://nssdc.gsfc.nasa.gov/planetary/factsheet/ and created a look-up table.

I then approximated the planetary orbits as circular and assumed that they all start aligned on the positive X axis on day 1 (which is good enough for this purpose). Given these assumptions we can plot the position of each planet (relative to the sun) at regular intervals using...

Where di is the number of days into the orbit, and Xi and Yi are the X and Y coordinates of where the planet will be.
Written in the style of an excel formula (with names instead of cell references) this looks like...
X=Radius*COS(2*PI()*(Days/Period))
Y=Radius*SIN(2*PI()*(Days/Period))
Two such sets of calculations are needed. One for the position of the planet, and one for the position of the earth on the same day. You *could* produce 8 sets of calculations - one for each planet, but frankly it's simpler and easier just to treat one planet (plus the earth) at a time, and look up (or type in) the orbital parameters you need.
The relative position of the planet from the earth is simply the difference between those two coordinates - ie if we subtract the position of the earth from the position of the planet, that gives us the position relative to the earth.
If we produce a table of such calculations at regular date intervals, we can then plot these relative positions on an X-Y scatter plot, which I've done to produce the above diagrams.
And there we have it.

