
I recently treated myself to a new laptop, and like any new computer owner, was working through the tedious process of migrating old files across from the previous computer. Now it seemed a great opportunity to do a little spring cleaning too, and so I thought it would be timely to clean up and sort through my old photos and to throw out any I really didn’t need anymore and were just taking up space.
As it happens, I dabble a little with astrophotography, where it’s commonplace to take hundreds of individual pictures and to combine them to produce a finished product, so I had shedloads of raw images I could potentially remove from my drive.
But as I searched through hundreds of folders, this quickly became a chore...
You literally have to click your way up and down the folder hierarchy, searching for where hundreds of junk photos might be, with little clue whether you’ve found them all, or where others might be hiding.
What I wanted was a map. Some kind of picture that showed me visually where the big folders and the big files were, without having to look for them myself.
Here’s what I came up with…

This image was generated on demand using VBA code running in Excel.
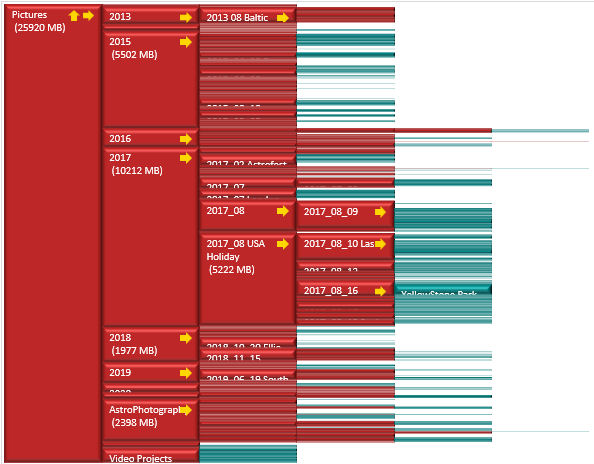
Here you can see my Pictures folder in red on the left, and subfolders of that in the next column, etc until (mostly towards the right) we see individual files shown. Each folder and file are drawn in proportion to their size, and the larger ones are labelled with their names and sizes too. Tiny files (less than a pixel tall) are not shown.
For a quick overview of how much storage is used and where – this is ideal.
Say for example, you were trying to move these files and only had a 10GB storage device to do it with. It's easy to see that you could probably move folders 2013 to 2016 in one batch, 2017 (at a pinch) in a second batch, and 2018 onwards for the rest.
But say 2017 was still too big, and you needed to check whether you could free up any files to make that really work. So this is why I added some clickable yellow arrows, which rebuild the folder map from a lower (or higher) starting point to make exploration a doddle.
In the image below, I’ve clicked the right-arrow on the 2017_08 USA Holiday to produce a more detailed picture of the folder hierarchy from that point downwards. I can see that I have lots and lots of photos were taken in Las Vegas (maybe I could afford to delete a few?) and I see a couple of large files (probably videos) of the Bellagio Fountains and our flight in a Helicopter. However there's one really big .mp4 file we shot in Yellowstone park, and doing something about that, might produce a more immediate win. Perhaps I could migrate that separately, (and therefore get the 2017 folder below that 10GB storage limit), or perhaps I could edit/trim the video to a smaller filesize, or even delete it completely (if the subject wasn't actually as interesting as it seemed at the time). What I choose to do with it doesn’t matter – the point is, that the information to tell you which folders and files need your attention - is all made highly visible.

To build this display in Excel, I wrote code in VBA to recursively descend down the file hierarchy from a user-selected start point – i.e. one selected with a folder browser. In each folder the code would iterate through each of the files, noting their name and size, and building a hierarchical data structure to represent the files and folders (using collections of collections) and propagating size totals up the hierarchy.
The display above can then be produced by ‘walking’ that hierarchy to produce the graphic you see. The graphics were drawn as 3D shaded rectangles onto a blank canvas provided by a Chart sheet. I added yellow arrows near the top right of every large rectangle, and assigned macros to rebuild the hierarchy from the indicated folder. To achieve this using just one callback, I check the identity of the calling shape in the callback code, and retrieve the full-path folder name which is written (invisibly) as a text label on each arrow.
The above coding is not excessively complex but produces a really useful display.